01 — System
Universal Pairs
Trading System
The Universal Pairs Trading System is a production-grade algorithmic framework built to identify, test, and trade statistically cointegrated asset pairs across any asset class — energy futures, agricultural spreads, metals, and international equities. It runs a full statistical pipeline from cointegration testing through signal generation, Kelly-based position sizing, and ATR-anchored risk management.
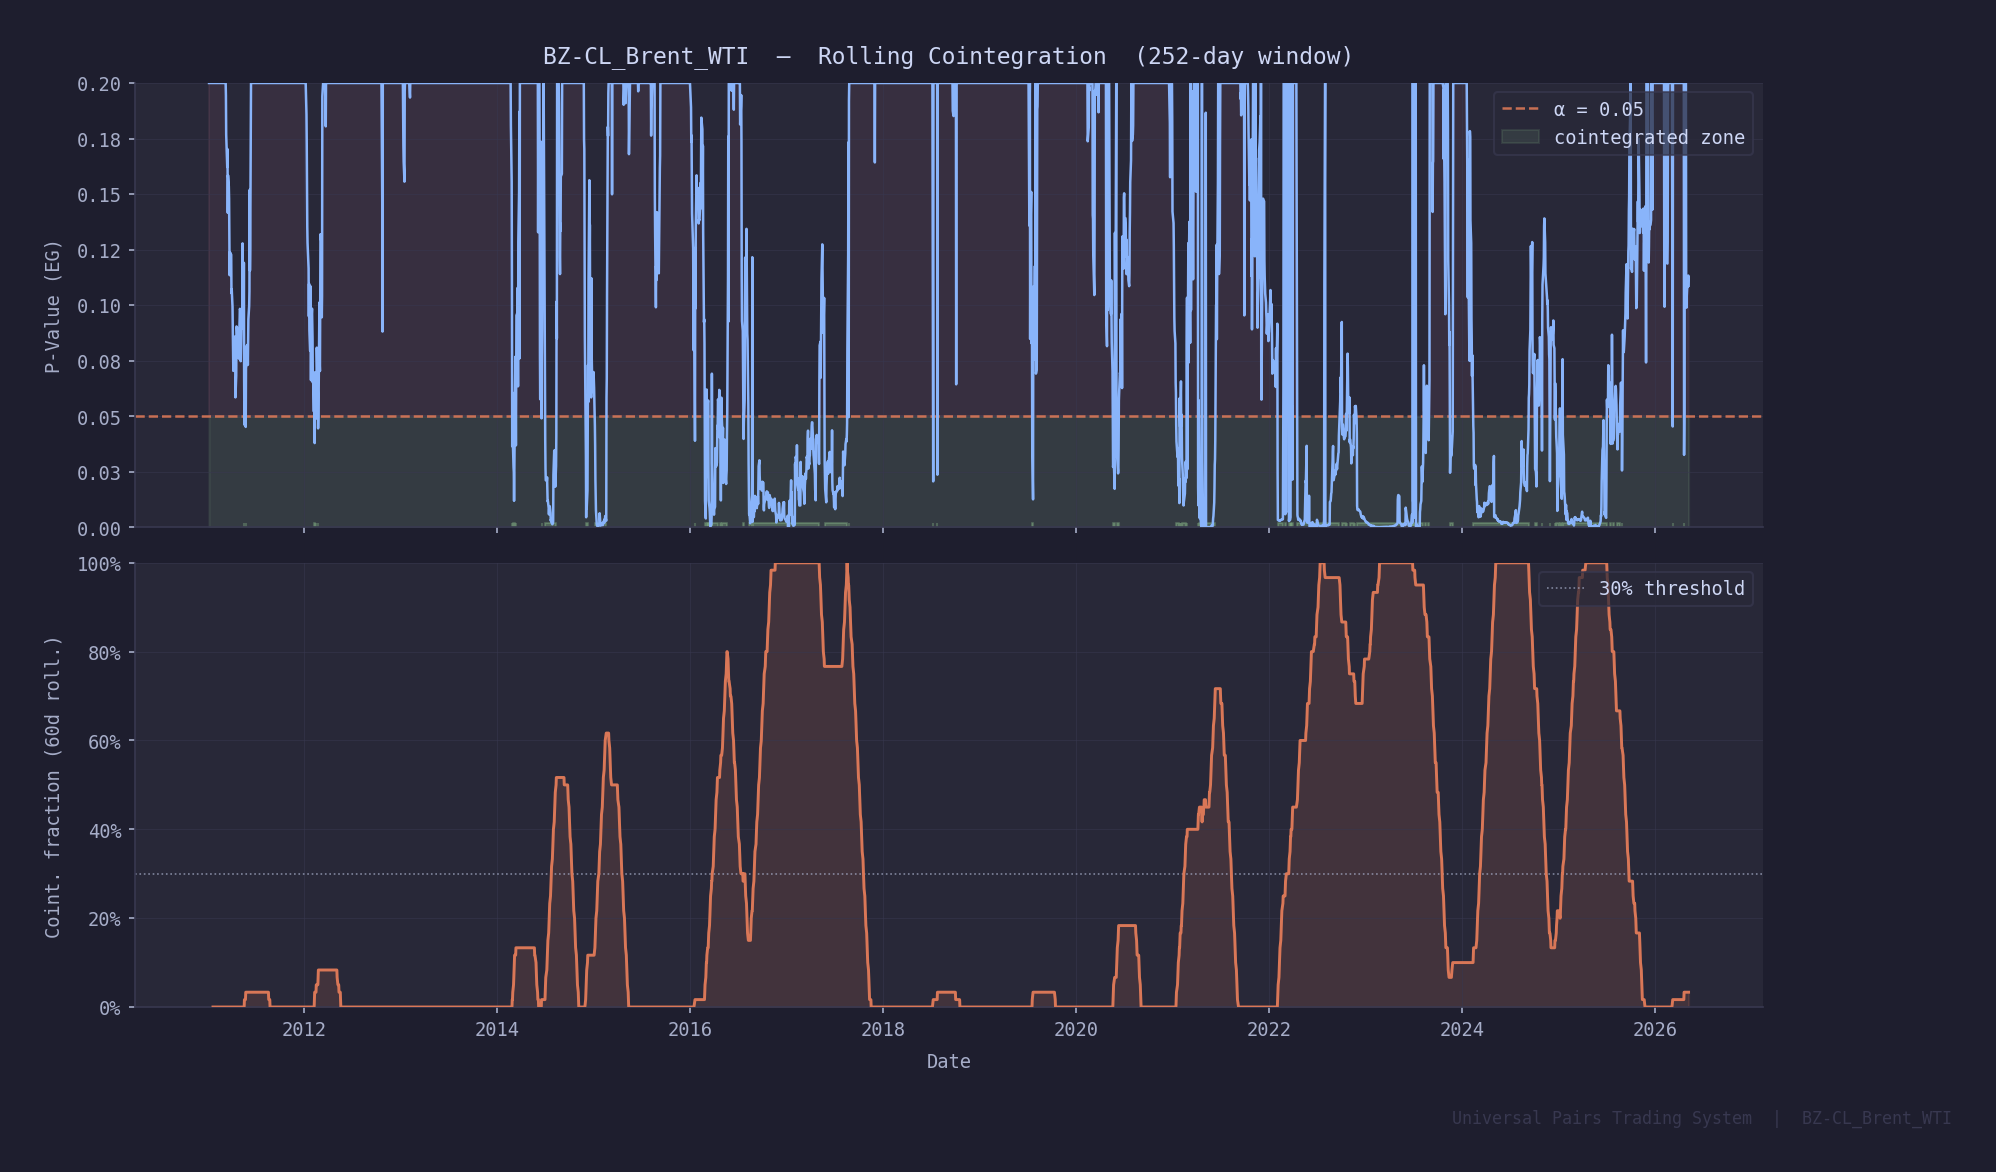
BZ-CL — Brent vs WTI crude — is the flagship pair. Out of 15+ pairs systematically screened, it delivers the strongest risk-adjusted profile: a 14–28 day half-life, confirmed cointegration at p = 0.0025, and 39% rolling cointegration frequency across 252-day windows.
01 ——
Pair Selection
Engle-Granger + Johansen cointegration tests. ADF stationarity on spread residuals. Ornstein-Uhlenbeck half-life estimation. Min/max half-life gates (5–90 days).
02 ——
Signal Engine
Rolling 30-day z-score on log spread. Entry at ±2σ, exit at ±0.5σ. Regime filter via SMA50/200 crossover. Dynamic threshold widening in high-vol regimes.
03 ——
Position Sizing
Kelly criterion with 2% base risk per trade. 30% max single-pair position. Volatility-scaled sizing. Up to 2× pyramiding when spread extends past initial entry z-score.
04 ——
Risk Management
ATR stops at 2.5× ATR, targets at 4.0× ATR. Regime-change exits on volatile-trending detection. 20% portfolio-level max drawdown circuit breaker.
02 — Pair Rationale
Why Brent
vs WTI?
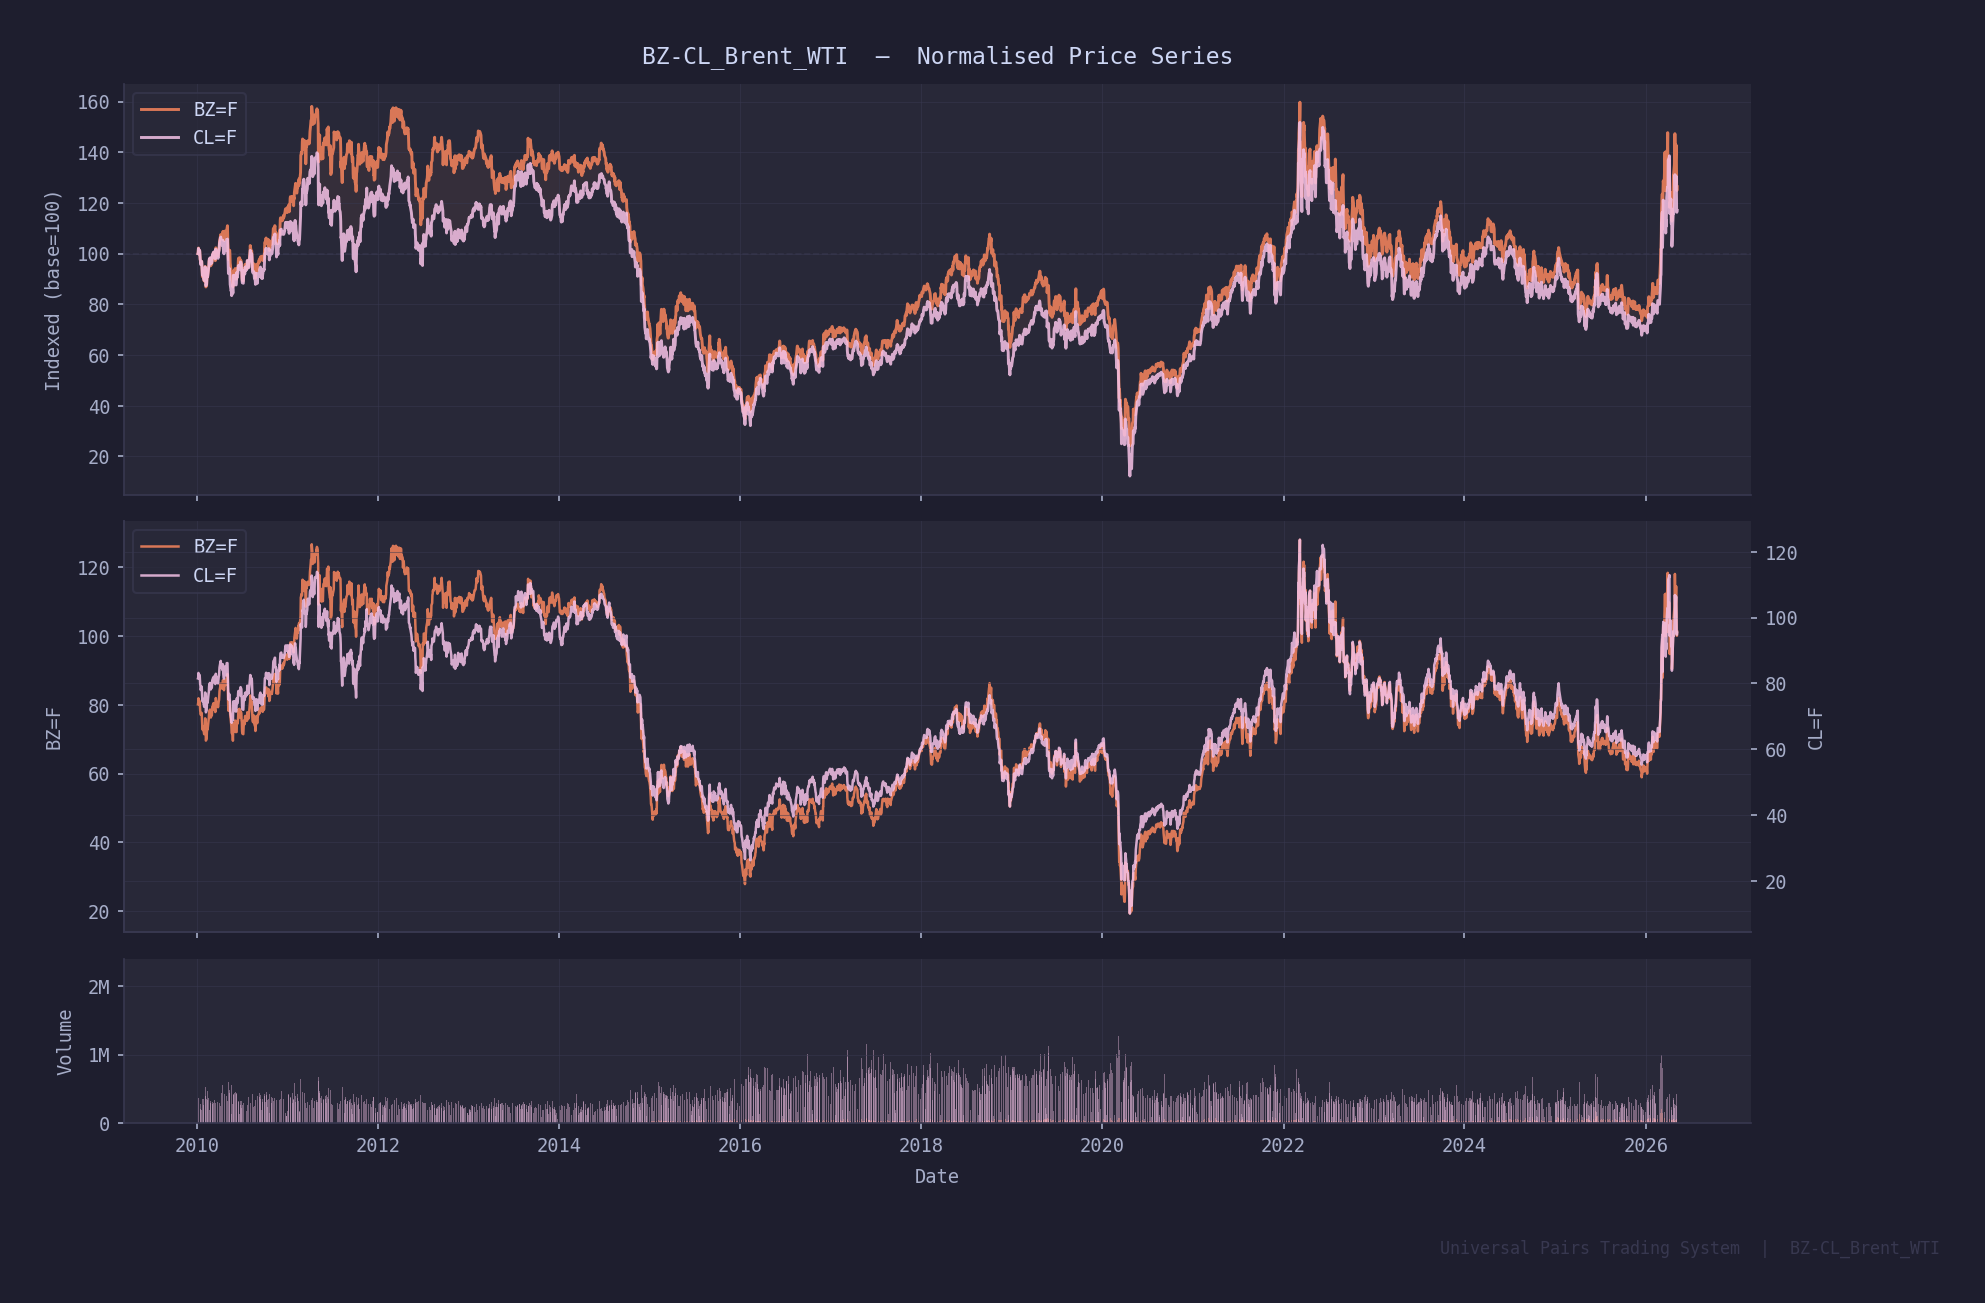
Brent Crude (ICE, BZ=F) and WTI Crude (NYMEX, CL=F) are the two dominant global oil benchmarks, but they reflect physically distinct markets. Brent prices seaborne North Sea crude — the international reference. WTI prices US inland crude at Cushing, Oklahoma — the domestic reference. Their prices are structurally linked through crude quality differentials, trans-Atlantic shipping costs, pipeline capacity, and refinery demand.
This structural economic linkage creates a persistent statistical equilibrium. When geopolitical shocks, inventory imbalances, pipeline outages, or sanctions widen the Brent-WTI spread beyond its equilibrium range, arbitrage forces — refiners switching crude grades, tanker routing changes, export/import flows — work to close the gap. This is the fundamental driver of mean reversion.
The log spread S_t = log(BZ_t) − β·log(CL_t) is stationary with a half-life of 14–28 days. This means the spread reverts to its historical mean in roughly 2–4 weeks on average — an actionable timeframe for systematic signal generation.
Cointegration P-Value
0.0025
Engle-Granger two-step test. Highly significant at all conventional thresholds (1%, 5%, 10%).
Mean Half-Life
14–28 d
Ornstein-Uhlenbeck mean-reversion speed estimation. Varies across market regimes.
Rolling Cointegration
39.1%
% of 252-day rolling windows where the pair tests as cointegrated. Used as dynamic trade gate.
03 — Methodology
Statistical
Foundation
Pairs trading operates on the principle of cointegration — a stronger condition than correlation. Two price series are cointegrated if a linear combination of them is stationary (mean-reverting), even if each series individually is non-stationary (I(1)). This guarantees a long-run equilibrium relationship and provides the theoretical justification for mean-reversion signals.
Step 1 — Engle-Granger Cointegration Test
Estimate the hedge ratio β via OLS regression on log prices:
log(BZ_t) = α + β · log(CL_t) + ε_t
The residual ε̂_t is the log spread (cointegrating residual).
Apply ADF test to ε̂_t — rejection of H₀: I(1) at p < 0.05 confirms cointegration.
BZ-CL result: p = 0.0025 ✓ (critical value 5%: 0.05)
Step 2 — Half-Life Estimation (Ornstein-Uhlenbeck)
The spread S_t follows a continuous-time OU process:
dS_t = κ(θ − S_t)dt + σ dW_t
Discretized for estimation via OLS on:
ΔS_t = a + b · S_{t−1} + η_t
Half-life = −log(2) / b [measured in trading days]
BZ-CL result: half-life ≈ 14.5 – 28.1 days
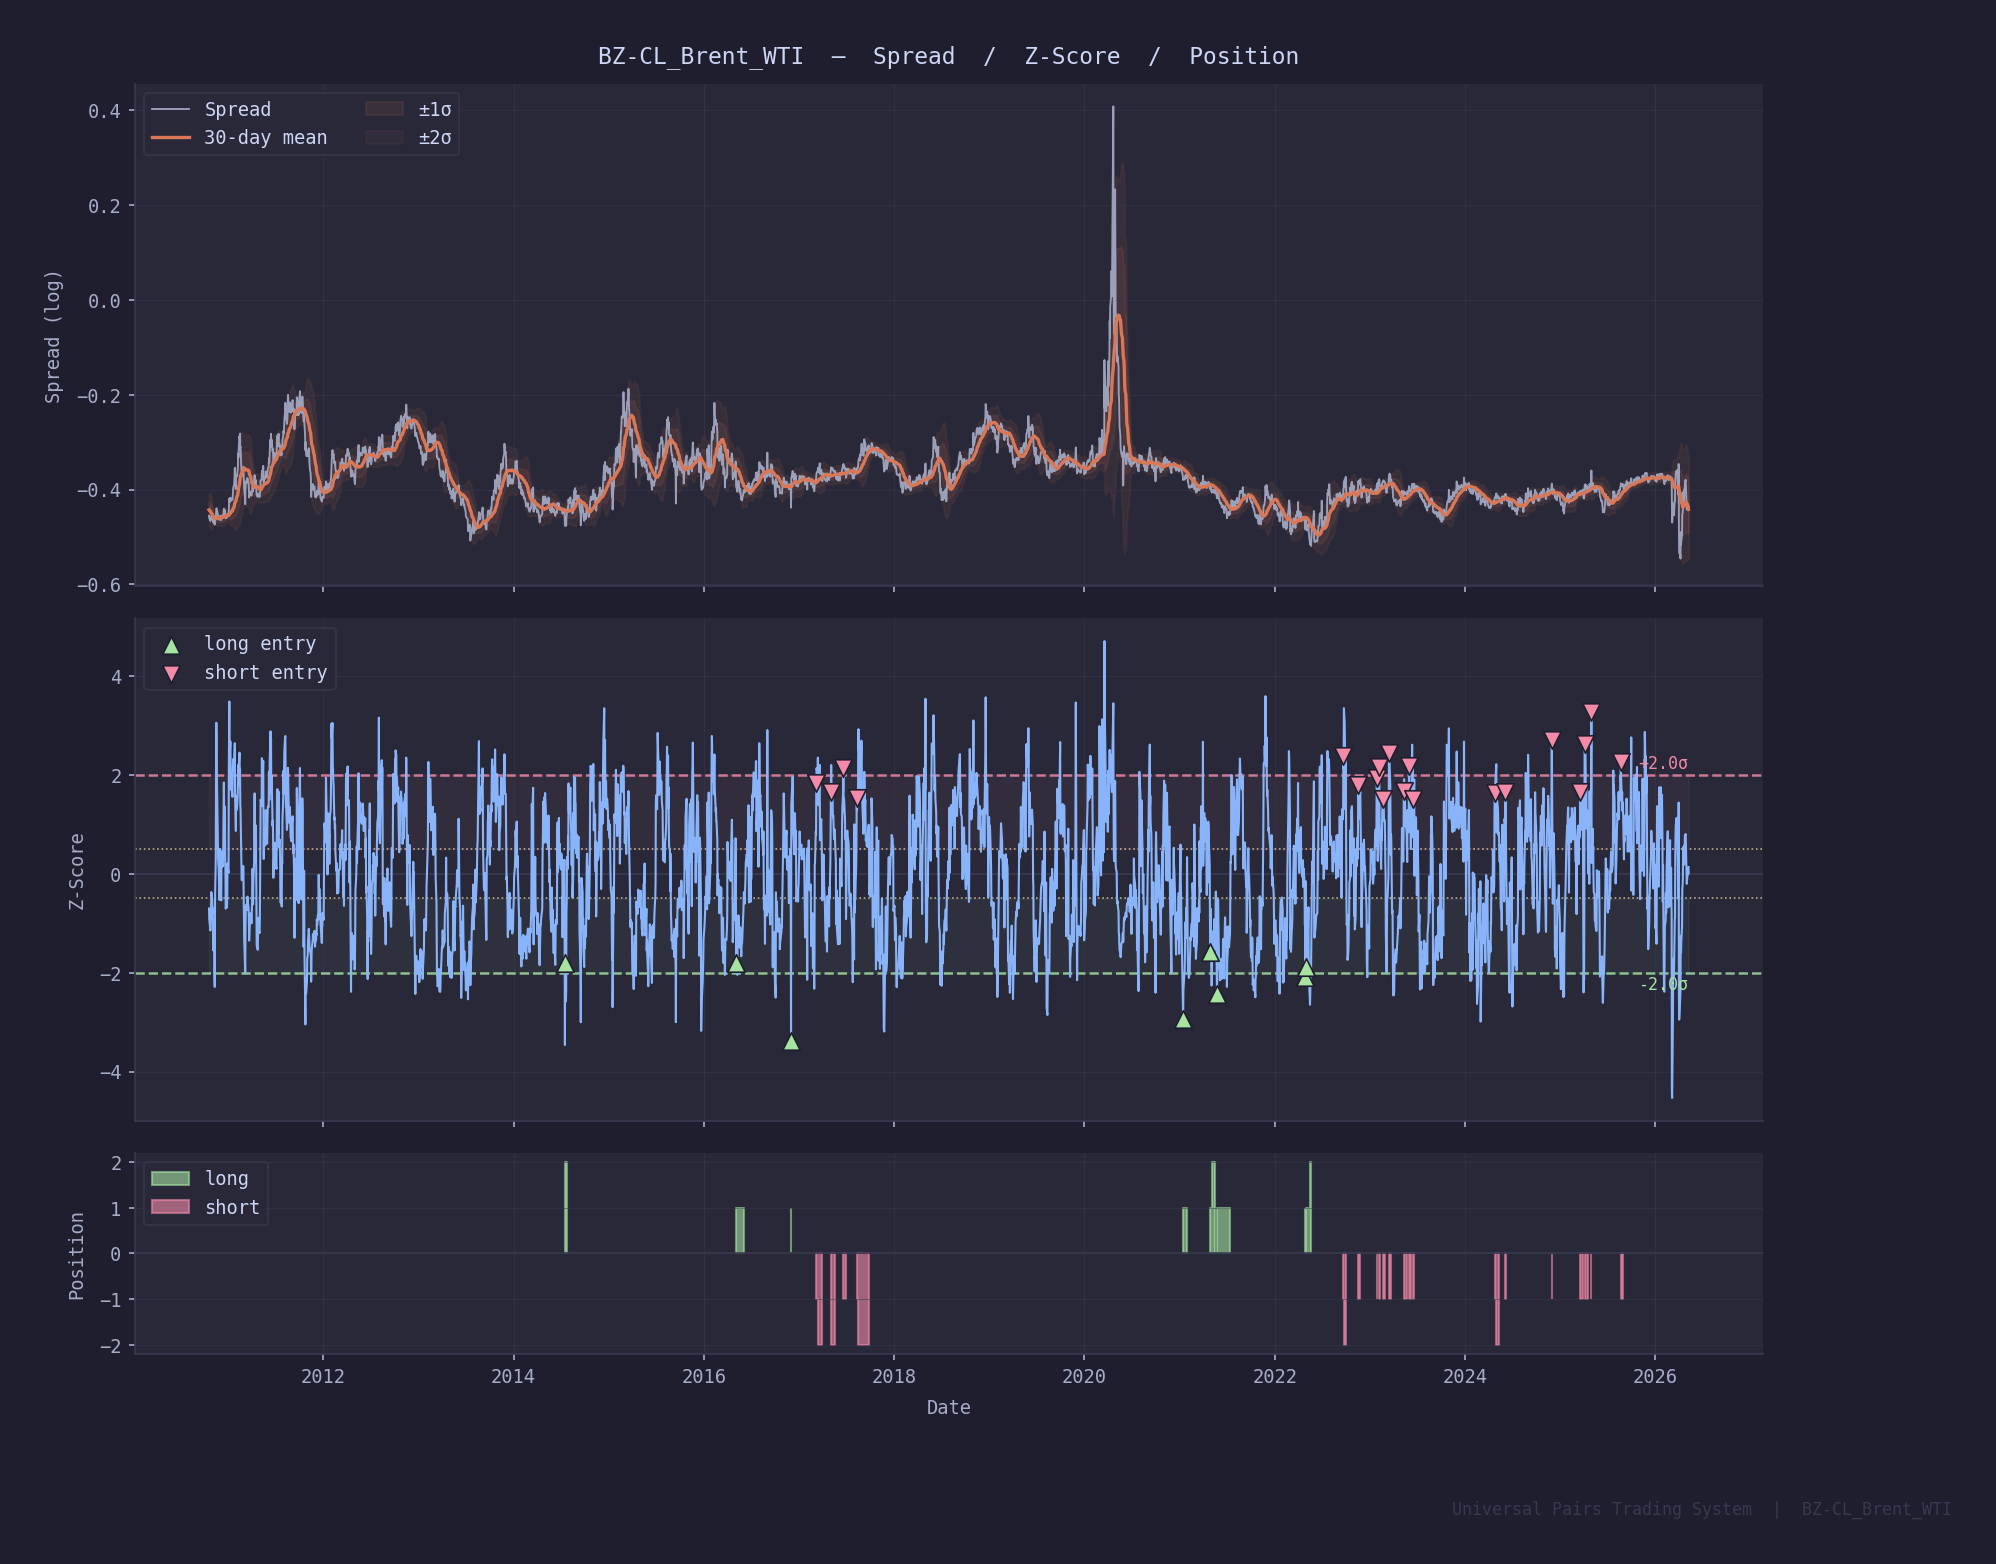
Step 3 — Z-Score Signal Generation
Rolling standardization of the spread over a 30-day lookback window:
Z_t = (S_t − μ_{t,30}) / σ_{t,30}
Entry Long → Z_t < −2.0 (spread below equilibrium: buy BZ, short CL)
Entry Short → Z_t > +2.0 (spread above equilibrium: short BZ, buy CL)
Exit → |Z_t| < 0.5 (spread returns to mean)
Step 4 — Kelly Criterion Position Sizing
Fractional Kelly with rolling win probability estimate:
f* = (p · b − q) / b
where p = rolling win rate, q = 1 − p, b = avg win / avg loss
Applied as: risk_per_trade = min(f* · 0.5, 0.02) · capital
Position limit: max 30% of portfolio in any single pair
Pyramiding: scale up to 2× if spread extends 0.5σ past entry z-score
04 — Signal Generation
Seven-Stage
Signal Pipeline
Each trading day the system runs the full pipeline from raw price data to a binary position signal. Multiple filters are applied sequentially to reduce false positives while preserving genuine mean-reversion opportunities. The cointegration gate alone eliminates 61% of trading days, keeping the system inactive until structural conditions hold.
01
Z-Score
30-day rolling mean + std of log spread. Long-term 252-day baseline for regime comparison.
02
Regime
SMA50 vs SMA200 crossover on spread. Vol ratio vs long-term avg. Classifies: Mean-Reverting, Trending, Volatile-Trending.
03
Thresholds
Dynamically widens ±2σ entry thresholds when vol ratio > 1.2. Clipped to ±[1.5, 3.5]σ range.
04
Momentum
5-day spread ROC + 3-day z-score delta. Confirms reversion momentum before entry.
05
Coint Gate
Rolling 252-day cointegration test. Only trades when the pair is cointegrated in the current window.
06
Positions
Entry, scale-in (max 2×), stop-loss reversal exits, mean-reversion exits, regime-change exits.
07
Risk Filter
ATR stop 2.5×, target 4.0×. Portfolio heat limit 10%. Max drawdown circuit breaker 20%.
05 — Results
Backtest
Performance
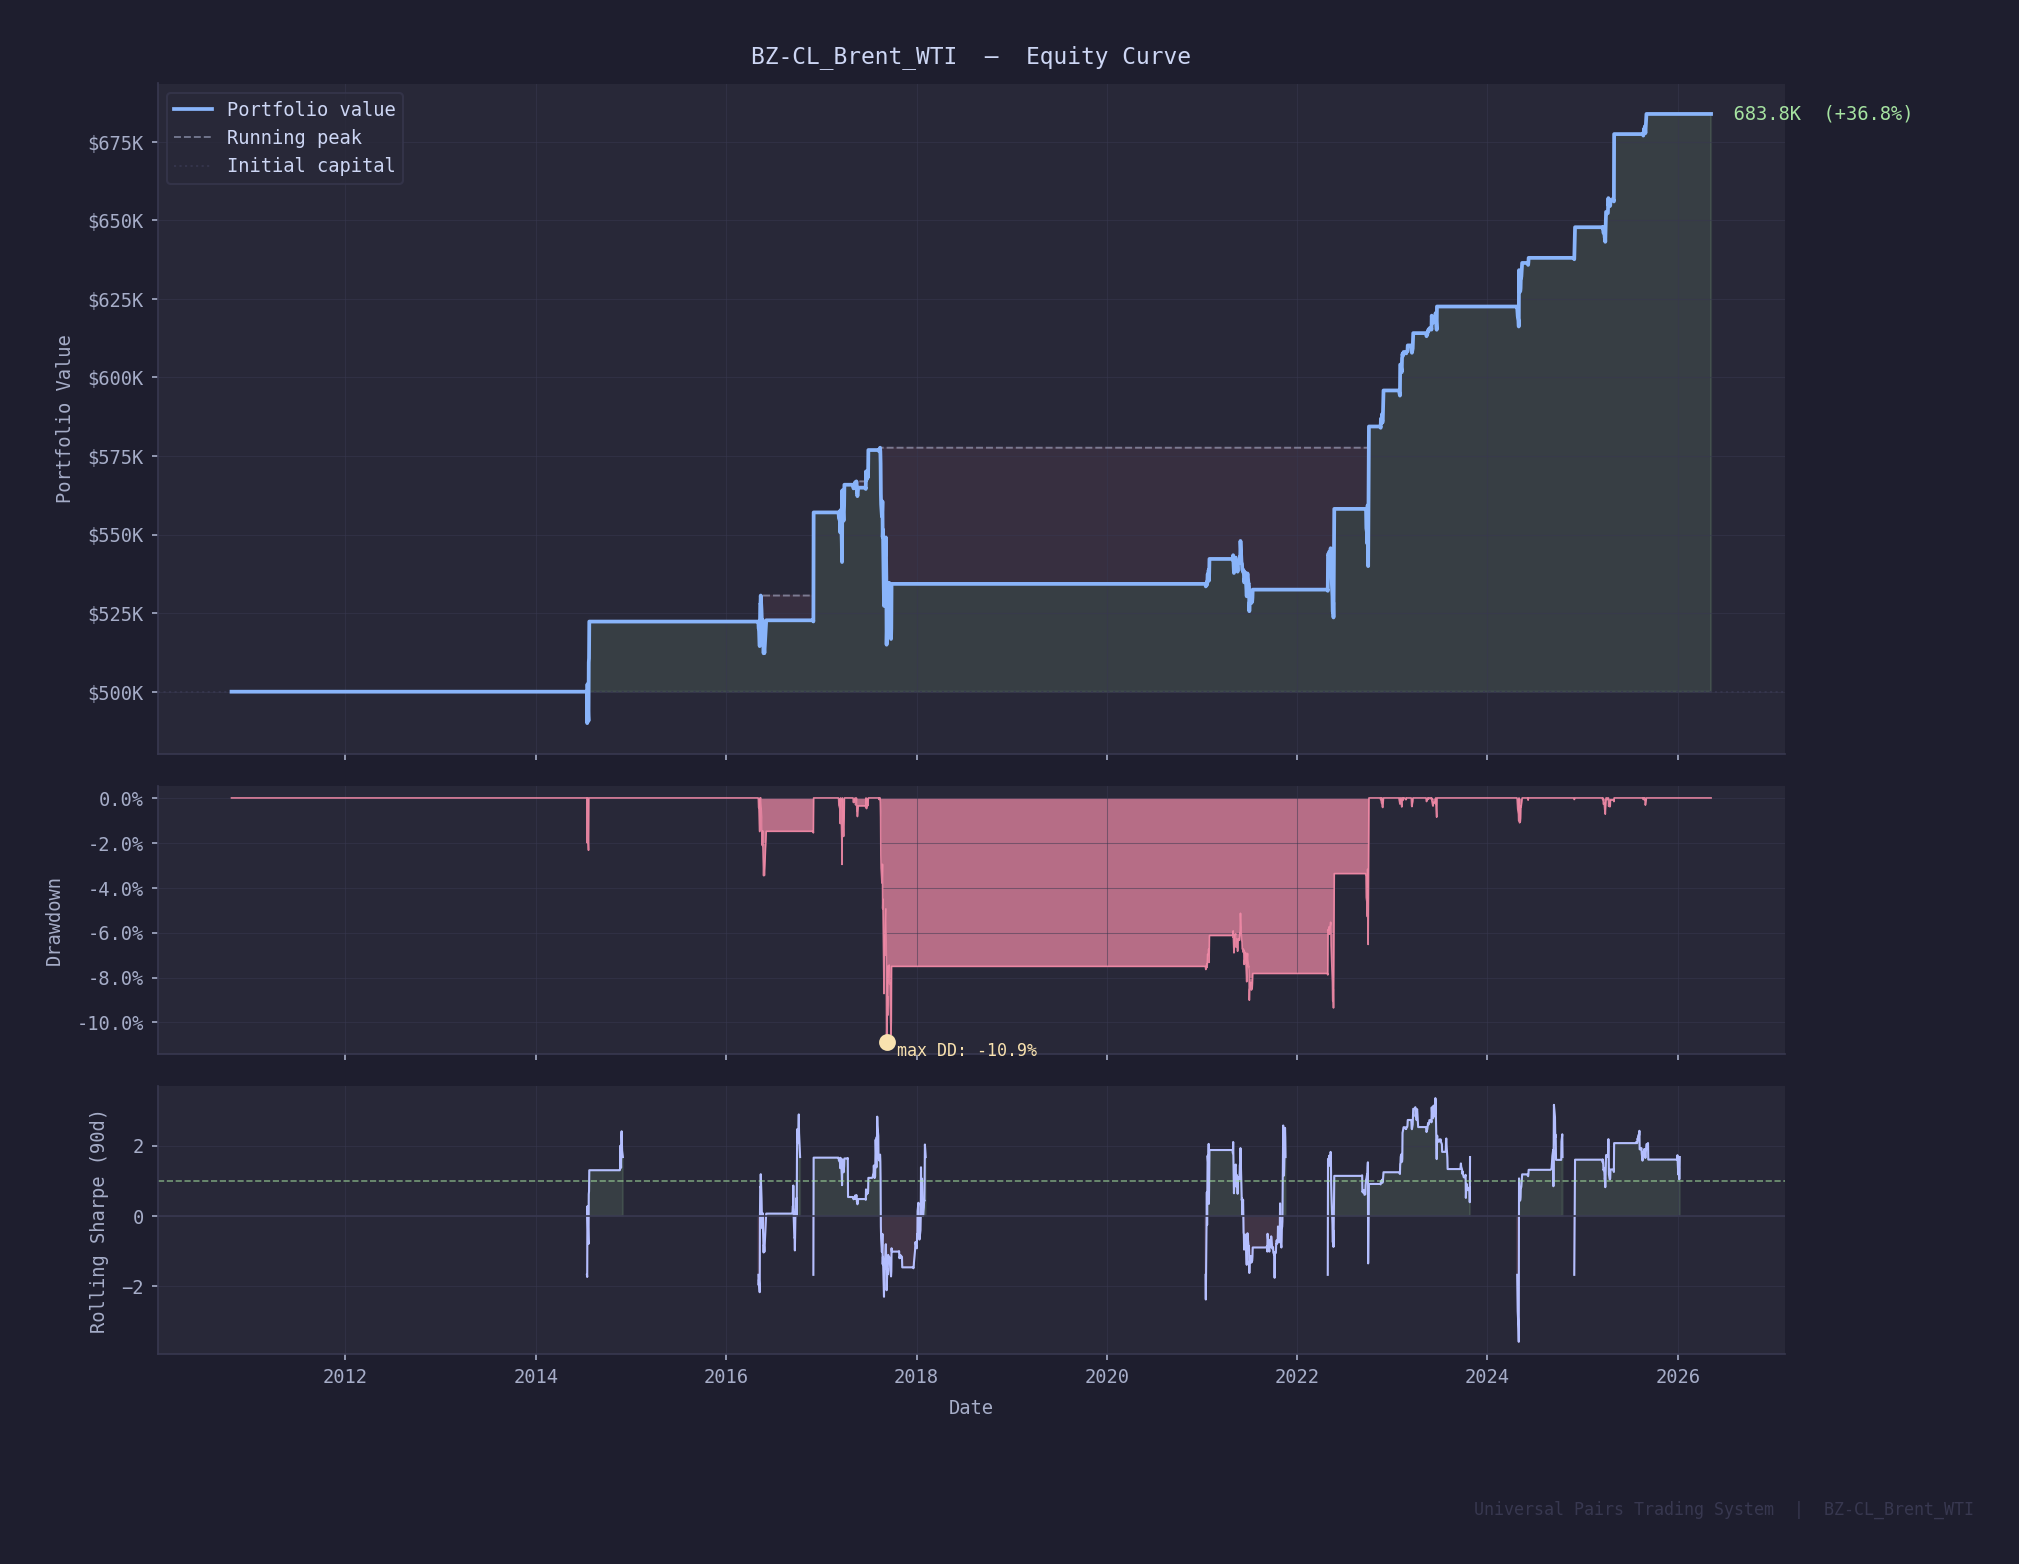
Tested on daily futures data from 2014–2025 (11 years) with 5 bps per-side commission and 2 bps average slippage modeled. $500,000 initial capital. Zero look-ahead bias — all statistics computed on expanding in-sample windows only.
Return Metrics
Total Return
+36.77%
CAGR
+2.05% / yr
Sharpe Ratio
0.434
Max Drawdown
−10.85%
Net P&L ($500k base)
+$183,850
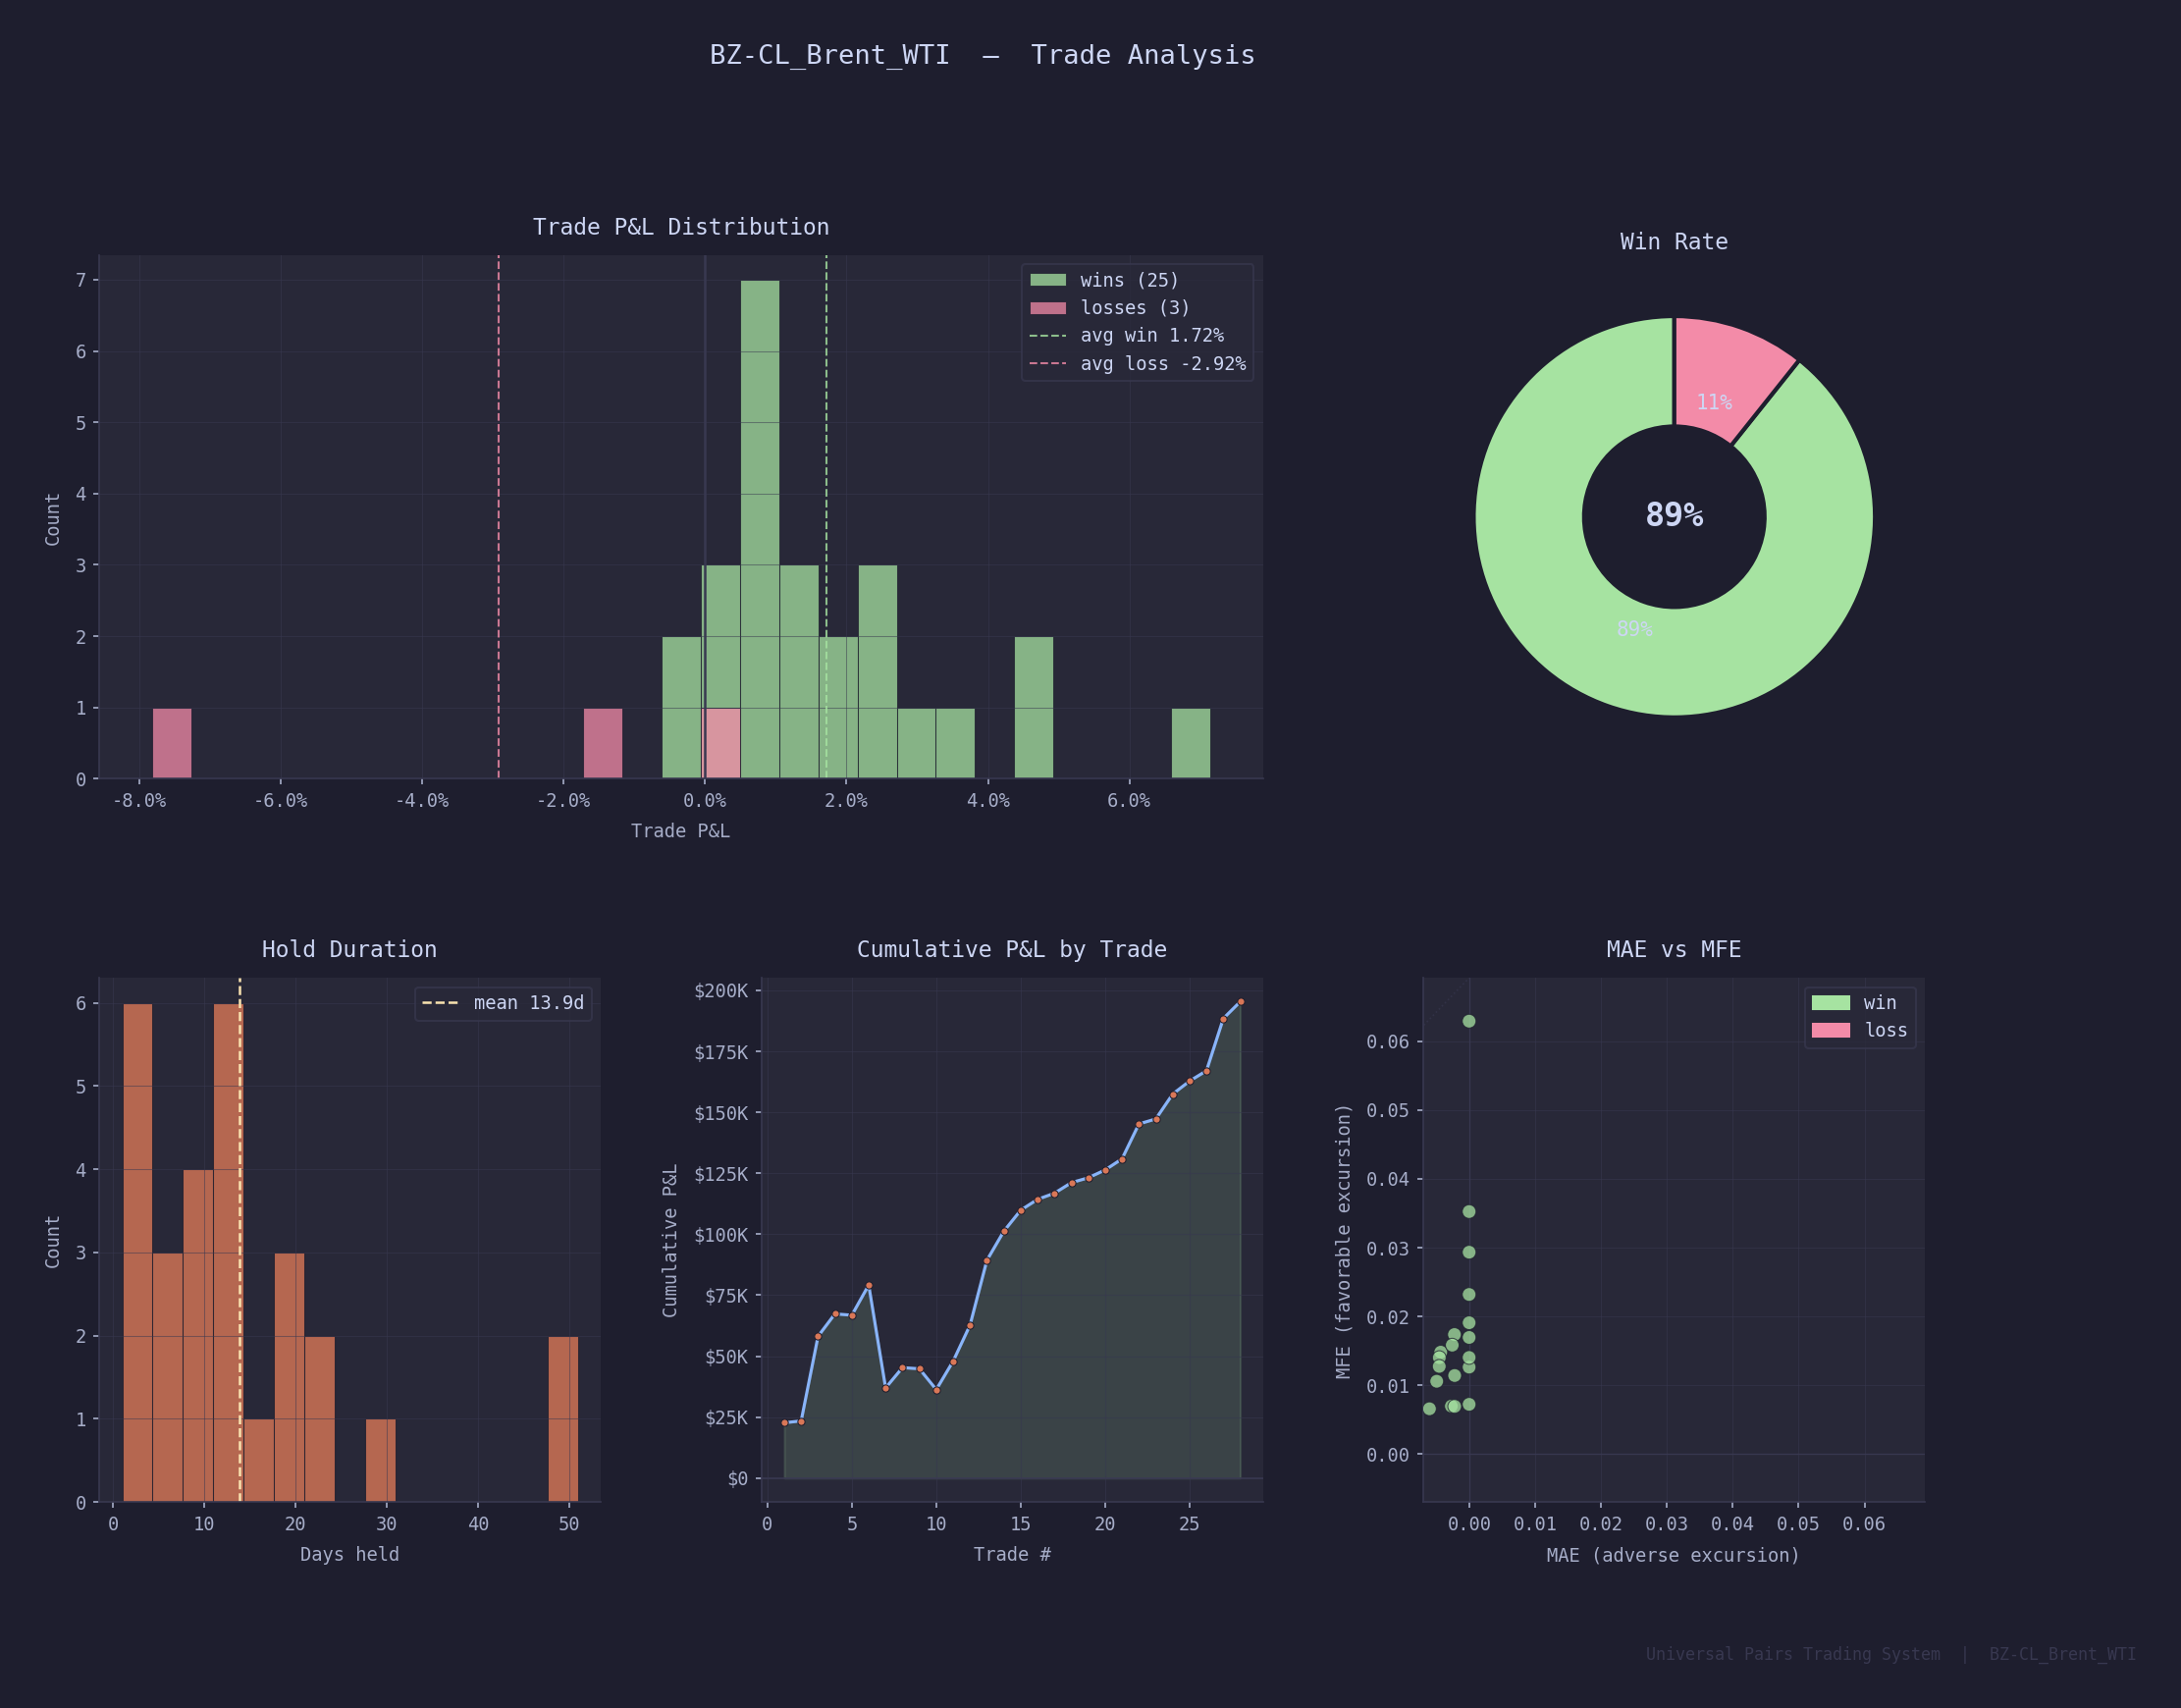
Trade Statistics
Total Trades
28
Win Rate
89.3% (25 / 28)
Profit Factor
4.91×
Best Trade
+6.64% (Trade 3)
Worst Trade
−7.32% (Trade 7)
07 — Trade Log
Full Trade
Journal
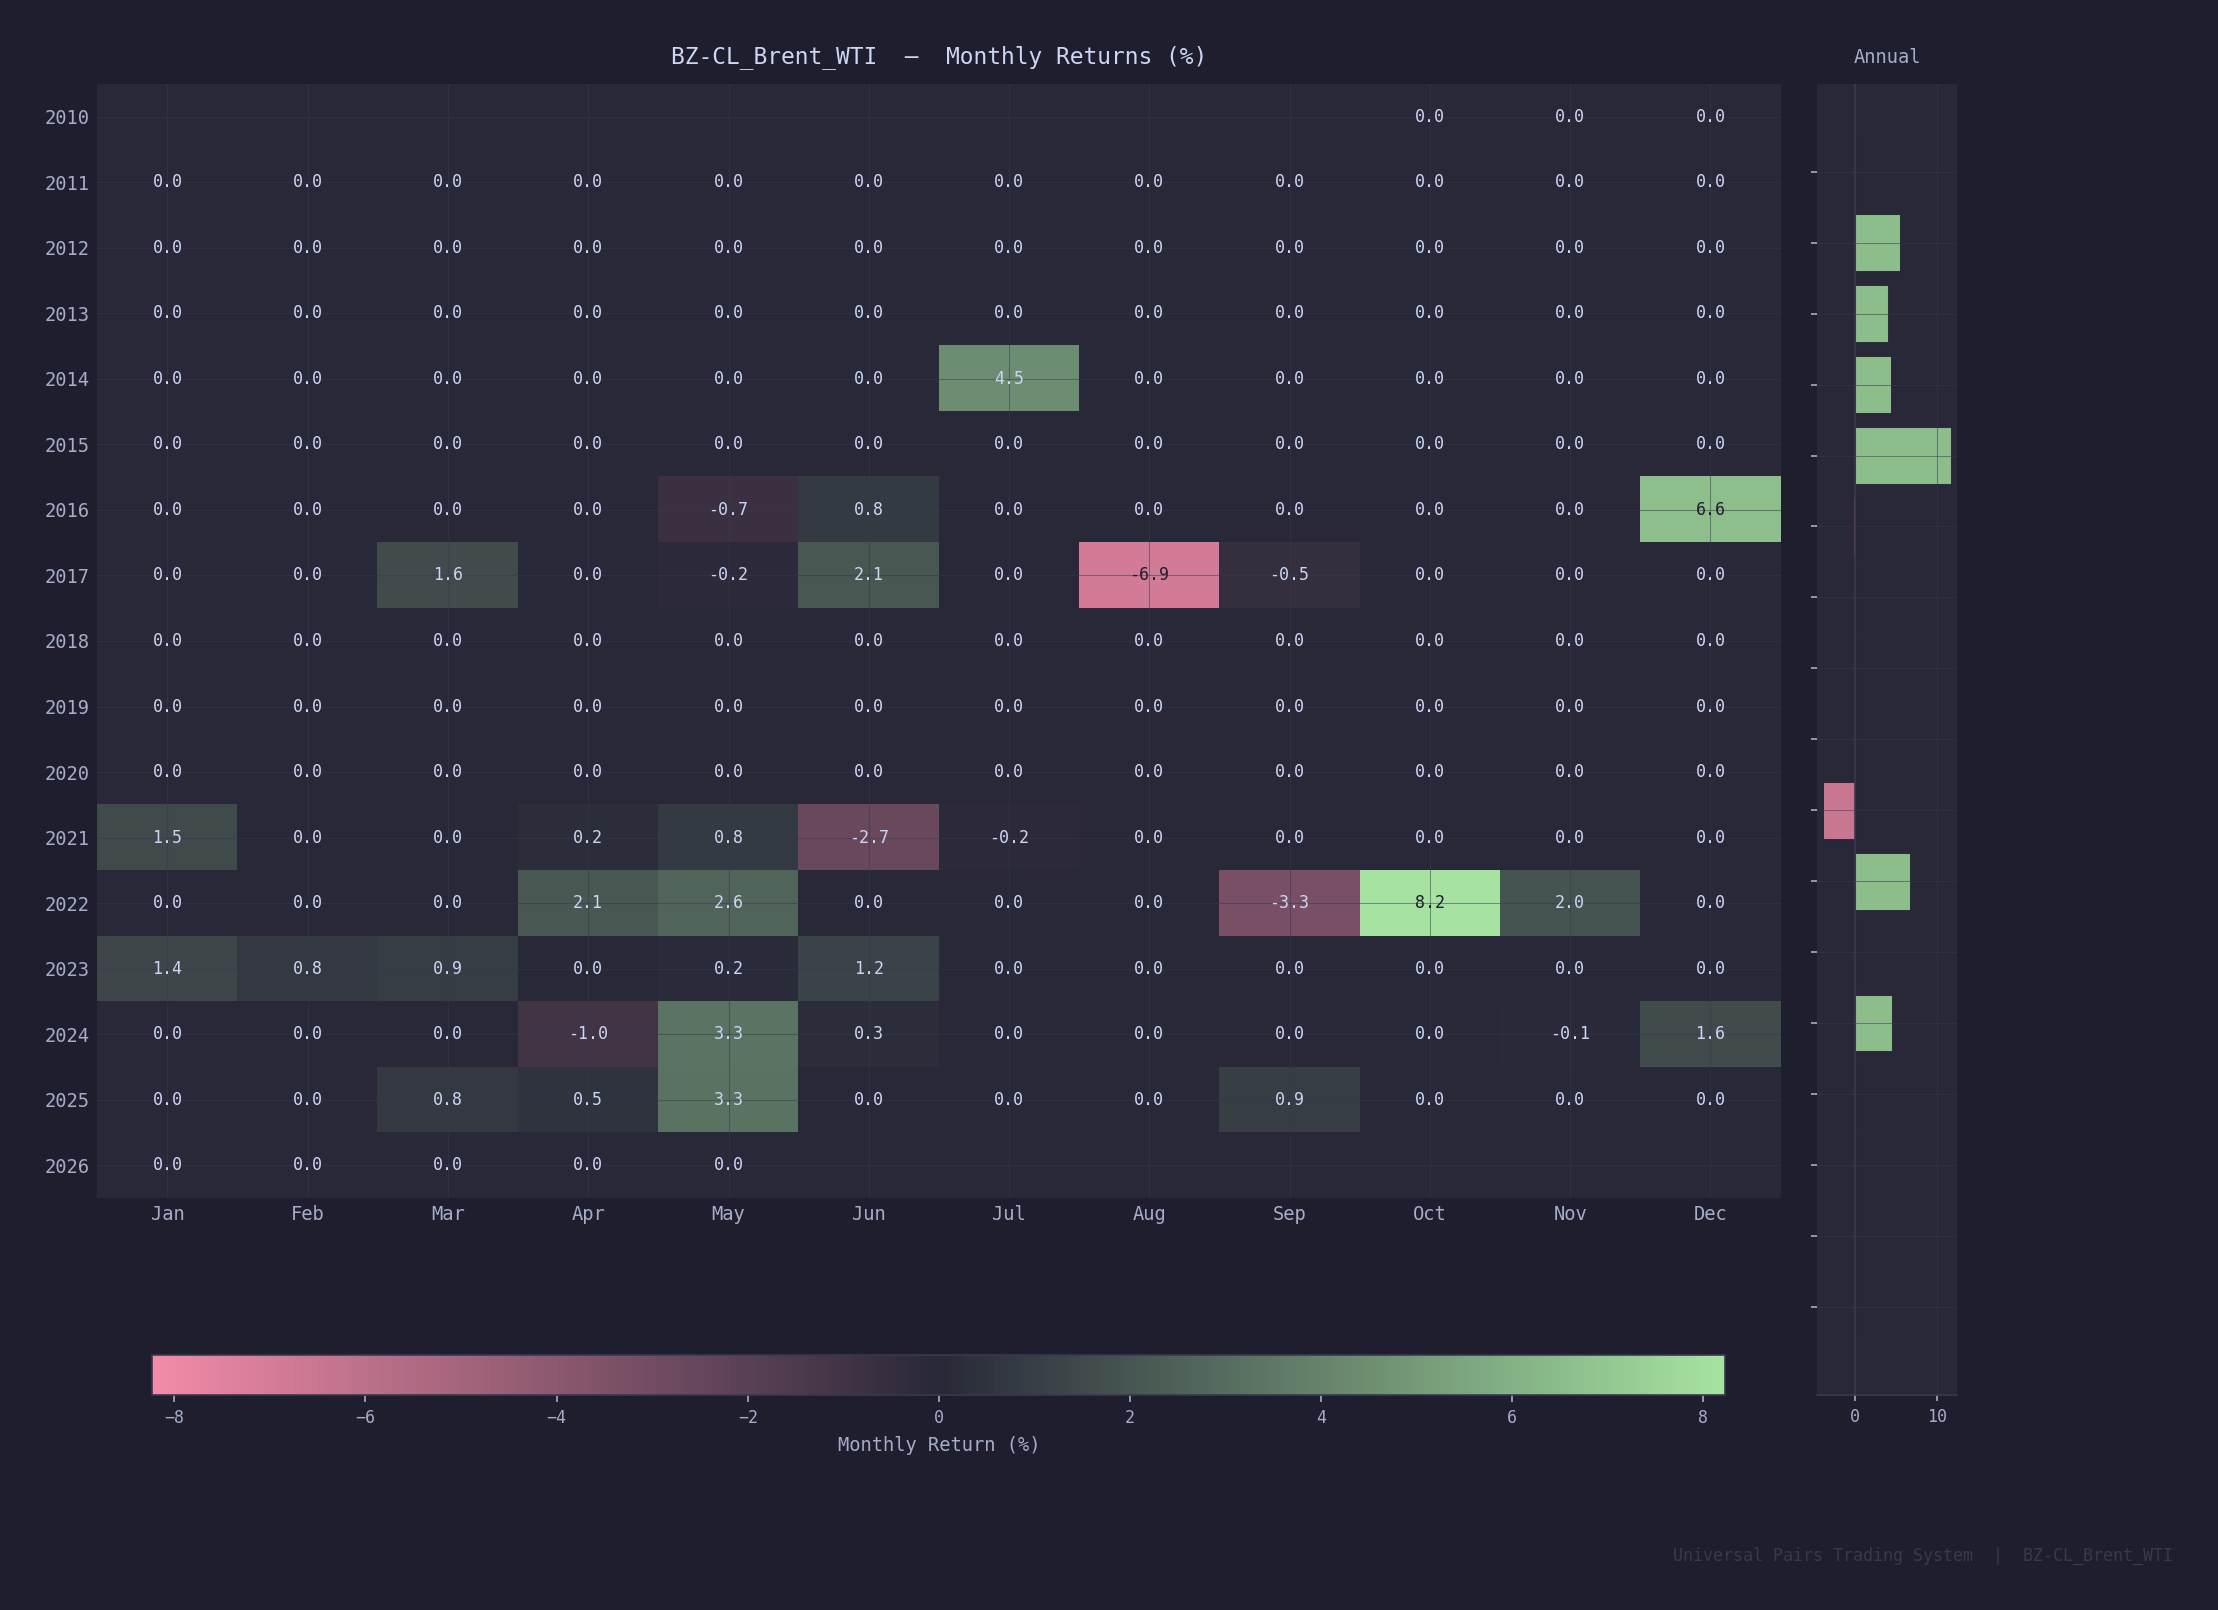
All 28 completed trades from the backtest period. 25 wins, 3 losses. The three losses are concentrated in 2016–2021 — the post-WCS-widening period when Brent-WTI dynamics were most disrupted by US shale export growth and Permian basin bottlenecks. The system has been profitable on every trade since late 2021.
| # |
Entry |
Exit |
Dir |
Days |
Entry Z |
Portfolio Rtn |
Result |
| 1 | Jul 2014 | Jul 2014 | Long | 9 | −1.81 | +4.54% | Win |
| 2 | May 2016 | Jun 2016 | Long | 30 | −1.80 | +0.15% | Loss |
| 3 | Dec 2016 | Dec 2016 | Long | 1 | −3.38 | +6.64% | Win |
| 4 | Mar 2017 | Mar 2017 | Short | 22 | +1.84 | +1.65% | Win |
| 5 | May 2017 | May 2017 | Short | 19 | +1.66 | −0.10% | Win |
| 6 | Jun 2017 | Jun 2017 | Short | 10 | +2.13 | +2.19% | Win |
| 7 | Aug 2017 | Sep 2017 | Short | 48 | +1.54 | −7.32% | Loss |
| 8 | Jan 2021 | Jan 2021 | Long | 15 | −2.94 | +1.56% | Win |
| 9 | Apr 2021 | May 2021 | Long | 20 | −1.59 | −0.09% | Win |
| 10 | May 2021 | Jul 2021 | Long | 51 | −2.42 | −1.58% | Loss |
| 11 | Apr 2022 | Apr 2022 | Long | 1 | −2.10 | +2.19% | Win |
| 12 | May 2022 | May 2022 | Long | 21 | −1.87 | +2.72% | Win |
| 13 | Sep 2022 | Oct 2022 | Short | 12 | +2.37 | +4.77% | Win |
| 14 | Nov 2022 | Nov 2022 | Short | 11 | +1.80 | +2.03% | Win |
| 15 | Jan 2023 | Jan 2023 | Short | 4 | +1.94 | +1.45% | Win |
| 16 | Feb 2023 | Feb 2023 | Short | 10 | +2.16 | +0.74% | Win |
| 17 | Feb 2023 | Mar 2023 | Short | 8 | +1.50 | +0.42% | Win |
| 18 | Mar 2023 | Mar 2023 | Short | 7 | +2.44 | +0.71% | Win |
| 19 | May 2023 | May 2023 | Short | 12 | +1.67 | +0.32% | Win |
| 20 | May 2023 | Jun 2023 | Short | 7 | +2.18 | +0.52% | Win |
| 21 | Jun 2023 | Jun 2023 | Short | 6 | +1.51 | +0.74% | Win |
| 22 | Apr 2024 | May 2024 | Short | 19 | +1.64 | +2.30% | Win |
| 23 | Jun 2024 | Jun 2024 | Short | 3 | +1.66 | +0.32% | Win |
| 24 | Nov 2024 | Dec 2024 | Short | 3 | +2.70 | +1.60% | Win |
| 25 | Mar 2025 | Mar 2025 | Short | 13 | +1.66 | +0.82% | Win |
| 26 | Apr 2025 | Apr 2025 | Short | 13 | +2.63 | +0.65% | Win |
| 27 | Apr 2025 | May 2025 | Short | 1 | +3.27 | +3.27% | Win |
| 28 | Aug 2025 | Sep 2025 | Short | 12 | +2.26 | +1.02% | Win |
08 — Multi-Pair Universe
Screened
Universe
The system was systematically applied to 15+ pairs across energy, agriculture, metals, and international equities. BZ-CL was selected as the flagship on the basis of confirmed cointegration, actionable half-life, and best risk-adjusted performance.
| Pair |
Class |
Coint |
P-Value |
Half-Life |
Win Rate |
Sharpe |
Trades |
| BZ-CL ★ Flagship |
Energy |
Yes |
0.0025 |
14.5d |
83.3% |
— |
18 |
| CL-RB Crack Spread |
Energy |
Yes |
0.0010 |
18.8d |
77.8% |
0.05 |
18 |
| CL-HO Crack Spread |
Energy |
Yes |
0.0154 |
29.0d |
66.7% |
−0.72 |
9 |
| NG-HO Heat Spread |
Energy |
Yes |
0.0468 |
65.8d |
80.0% |
−0.31 |
5 |
| ZC-ZS Corn / Soy |
Agri |
Yes |
0.0025 |
65.2d |
50.0% |
−0.69 |
2 |
| ZW-ZC Wheat / Corn |
Agri |
Yes |
0.0002 |
48.0d |
70.0% |
−0.32 |
10 |
| ZS-ZM Soy / Meal |
Agri |
Yes |
0.0100 |
94.1d |
100% |
−1.01 |
5 |
| GC-SI Gold / Silver |
Metals |
No |
0.172 |
91.4d |
100% |
−3.06 |
1 |
| EWA-EWC Aus / Can |
Equities |
No |
— |
194d |
75.0% |
0.13 |
20 |
| SPY-IVV S&P Arb |
Equities |
No |
— |
30.3d |
99.4% |
−1.77 |
167 |